Verizon Wireless website is… (sorry)

Verizon Wireless Sorry Page
This is the page that comes up when the Verizon Wireless customer portal is unavailable.

At least, that’s what I infer because nowhere does the page actually say this.

Rather it tells me I can browse their marketing site while at the same time listing all customer options in the top navigation. Clicking on account links like “pay bill” simply returns you to this page.

Only after logging into their site with more than one browser did I notice the title of the page is “sorry.jsp”.

Agile software development, gender, and empathy

I’m reading Delusions of Gender: How Our Minds, Society, and Neurosexism Create Difference by Cordelia Fine.

Fine challenges the popular belief that women’s brains are hardwired to perform differently than men. Beliefs as old as gender roles but popularized in recent books like The Female Brain.

It is her discussion of empathy that interests me at the moment.

She acknowledges that studies frequently demonstrate women are more empathetic than men.

However, she argues those differences are most observable when gender stereotypes are foremost in people’s minds.

Simply asking people in advance to check a box indicating whether they are male or female increases differences in performance during evaluation while priming people with a social identification that cuts across gender reduces them.

Differences become less significant when studies control for the value subjects place in their own empathy. For example, they disappear when men and women are given the same social or material incentives to read and effectively address feelings in others.

Yes, it was possible with small changes to degrade women’s performance to the level of men. It was also just as possible to raise men’s performance up to the level of women.

The performance leveling applies to both aspects of empathy: the awareness of feelings in others and the ability to understand and identify with those feelings.

And this is why it is relevant to our male-dominated Agile software community.

In Agile/Lean, work is collaborative. Our essential identification is with the team. We move away from a focus on self and an abstract relationship with our employer and toward a visceral and immediate social connection with our co-workers. We work collaboratively and frequently with our customers and we define our work in terms of what benefit it offers our end users.

In that context, we are incentivized in ways that potentially make us more perceptive of and more caring towards others.

I realize empathy doesn’t necessarily lead to conscientious acts. But it is reasonable to assert that where my actions and decisions affect someone, my having empathy towards them gives me some advantage in acting and deciding in a way that provides them more benefit and less harm than I might otherwise.

In other words, I believe more empathy leads to more thoughtful developers and a chance at more effective, more beneficial software. Further, I believe empathy is a factor in creating a more socially aware, ethical software development community.

I already see a limit to this premise. The social context of a team may be too narrow particularly if it is composed on one class, one race and one gender. If we all think the same, have the same narrow set of experiences, problems and advantages will we become a self-directed team who still doesn’t give a rat’s ass about other people?

Based on the admittedly light summary provided in Delusions of Gender, when a social frame or incentives improved results, they did so across the board. When men were primed to value empathy, their ability to empathize improved in general.

Still, if this is a flaw then the answer is to build diverse teams. There are so many other reasons we should all be striving for that and a collaborative environment may in itself help us achieve that goal.

I find hope in this. Hope that Agile principles are not just a path to value narrowly defined but a way towards empathy, conscience and contribution.

Friday before labor day

He flies onto the train and sits knee to knee in front of me.

Dark t-shirt and jeans. Grasping a black plastic bag between his feet. Gray streaked hair. Flushed in this ridiculous heat but not sweating. Rough but not filthy. Not so old (not so much older than me) but too old to be putting up with this.

Swollen blue below one eye. Cracked above the other. Raw, inflated, white puss flesh and a long streak of red. Blood stipples out the pores of his chin. But his attention is to his hand. A locus of pain he clenches and shakes.

He asks me where the B meets the A.

I tell him he’s bleeding. He touches his face as if surprised that pain had a source.

He needs a clinic but St Vincents is bankrupt. Anyway, he rides the subway to Brooklyn. All night in a chair for an aspirin is not worth losing a shelter bed, his bed.

Adrenalized, returned from the looking glass he tells me what. I parse one sentence out of ten but I get his intent.

This is no movie. Two guys jumped him. They beat the crap out of him but he punched them to the ground. Kicked them in the face as hard as he could. Kicked them while they were down. Kicked them quiet.

Why do they pick on the old? They took $200. To his surprise and joy, they are worse for it. He’s on the B train. They need a doctor or a fucking grave.

This is one of those moments where a crowd is empty except for one man and the one person he happens to talk to.

I give him cash for food or bandages not enough for both. He reaches out to thank me. Touches my shoulder with the hand he touched the wounds on his face and gets off at my transfer. I remain locked in my seat. I’ll take the long way home.

Making an iteration/sprint burn up chart with Thoughtworks Studio Mingle

As I’ve said before, we use Thoughtworks Studio Mingle to track our backlogs.

One thing Mingle has not provided for us in the time we’ve worked with it is a daily burn up. Kind of shocking.

Last month, we migrated our instance to the EC2 cloud. I took advantage of that migration to un-cruft our Mingle instance, apply the XP template and simplify card types and states.

Now time to stop dumping data out of mingle to report status. Yes. Kind of shocking.

The first step was to track the data points we need for a burn up.

That involved creating a series of date fields to track the day on which a story moves from in analysis to ready for dev, in dev, in qa, ready for customer (QA done) and customer accepted.

We also need a way to have those dates recorded automatically as part of moving cards from one state to another.

Mingle card transitionSo we set up Mingle card transitions.

This replaces the drag and drop behavior of a card from one swim lane to another with a button link on the card. This a bummer for our product team but it allows us to script transitions to both change the status and set the appropriate date field.

Now to setup a burn up chart using Mingle charts and mql.

{% dashboard-panel %}
{% panel-heading %}Current iteration burnup{% panel-heading %}
{% panel-content %}
{{
data-series-chart
conditions: (‘Type’ = ‘Story’ OR ‘Type’ = ‘Defect’ OR ‘Type’ = ‘Task’) AND ‘Iteration – Scheduled’ = (Current Iteration) AND ‘Status’ > ‘In Analysis’ AND ‘Status’ is not ‘Deleted’ AND ‘Status’ is not ‘Blocked’ AND ‘Estimate’ IS NOT NULL AND ‘Iteration – Analysis Completed’ IS NOT NULL
labels: SELECT DISTINCT ‘Date Estimated’
x-title: Date
x-labels-start: 2010-08-10
x-labels-end: 2010-08-21
y-title: Estimated Scope in Story Points
show-start-label: false
data-point-symbol: diamond
data-labels: true
chart-height: 500
chart-width: 800
plot-height: 375
plot-width: 500
trend-ignore: zeroes-at-end-and-last-value
cumulative: true
series:
– label: Total Scope
color: black
data: SELECT ‘Date Estimated’, SUM(‘Estimate’)
– label: Development Complete
color: yellow
line-width: 1
data: SELECT ‘Date Dev Complete’, SUM(‘Estimate’) WHERE ‘Status’ >= ‘Development Complete’
– label: QA Complete
color: orange
line-width: 1
data: SELECT ‘Date QA Complete’, SUM(‘Estimate’) WHERE ‘Status’ >= ‘QA Complete’
– label: Accepted
color: blue
data: SELECT ‘Date Accepted’, SUM(‘Estimate’) WHERE ‘Status’ >= ‘Accepted’
}}
{% panel-content %}
{% dashboard-panel %}

Observations:

  • I had to hard code date start and date end in x-labels-start and x-labels-end but otherwise, I was able to use the project variable ‘Iteration – Scheduled’ = (Current Iteration) that’s part of the XP Template.
  • Burn up is accomplished by setting cumulative:true. Unfortunately, I can’t get trend lines to work as a result.

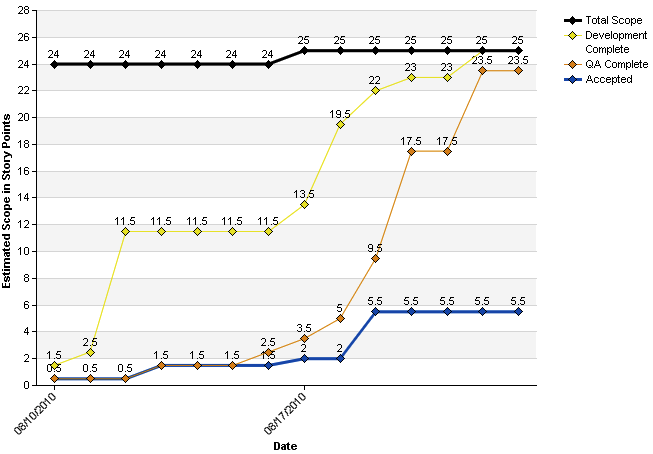
Here’s what the result looks like:

Burn up using Mingle data series chart

This chart along with selected summary counts and tables allows us a real time dashboard of the health of our sprints.

As you can tell from the burn up, we have work to do improving flow in our iterations.

Anyway, reporting is a work in progress. As is everything.