As I’ve said before, we use Thoughtworks Studio Mingle to track our backlogs.
One thing Mingle has not provided for us in the time we’ve worked with it is a daily burn up. Kind of shocking.
Last month, we migrated our instance to the EC2 cloud. I took advantage of that migration to un-cruft our Mingle instance, apply the XP template and simplify card types and states.
Now time to stop dumping data out of mingle to report status. Yes. Kind of shocking.
The first step was to track the data points we need for a burn up.
That involved creating a series of date fields to track the day on which a story moves from in analysis to ready for dev, in dev, in qa, ready for customer (QA done) and customer accepted.
We also need a way to have those dates recorded automatically as part of moving cards from one state to another.
 So we set up Mingle card transitions.
This replaces the drag and drop behavior of a card from one swim lane to another with a button link on the card. This a bummer for our product team but it allows us to script transitions to both change the status and set the appropriate date field.
Now to setup a burn up chart using Mingle charts and mql.
{% dashboard-panel %}
{% panel-heading %}Current iteration burnup{% panel-heading %}
{% panel-content %}
{{
data-series-chart
conditions: (‘Type’ = ‘Story’ OR ‘Type’ = ‘Defect’ OR ‘Type’ = ‘Task’) AND ‘Iteration – Scheduled’ = (Current Iteration) AND ‘Status’ > ‘In Analysis’ AND ‘Status’ is not ‘Deleted’ AND ‘Status’ is not ‘Blocked’ AND ‘Estimate’ IS NOT NULL AND ‘Iteration – Analysis Completed’ IS NOT NULL
labels: SELECT DISTINCT ‘Date Estimated’
x-title: Date
x-labels-start: 2010-08-10
x-labels-end: 2010-08-21
y-title: Estimated Scope in Story Points
show-start-label: false
data-point-symbol: diamond
data-labels: true
chart-height: 500
chart-width: 800
plot-height: 375
plot-width: 500
trend-ignore: zeroes-at-end-and-last-value
cumulative: true
series:
– label: Total Scope
color: black
data: SELECT ‘Date Estimated’, SUM(‘Estimate’)
– label: Development Complete
color: yellow
line-width: 1
data: SELECT ‘Date Dev Complete’, SUM(‘Estimate’) WHERE ‘Status’ >= ‘Development Complete’
– label: QA Complete
color: orange
line-width: 1
data: SELECT ‘Date QA Complete’, SUM(‘Estimate’) WHERE ‘Status’ >= ‘QA Complete’
– label: Accepted
color: blue
data: SELECT ‘Date Accepted’, SUM(‘Estimate’) WHERE ‘Status’ >= ‘Accepted’
}}
{% panel-content %}
{% dashboard-panel %}
{% dashboard-panel %}
Observations:
- I had to hard code date start and date end in x-labels-start and x-labels-end but otherwise, I was able to use the project variable ‘Iteration – Scheduled’ = (Current Iteration) that’s part of the XP Template.
- Burn up is accomplished by setting cumulative:true. Unfortunately, I can’t get trend lines to work as a result.
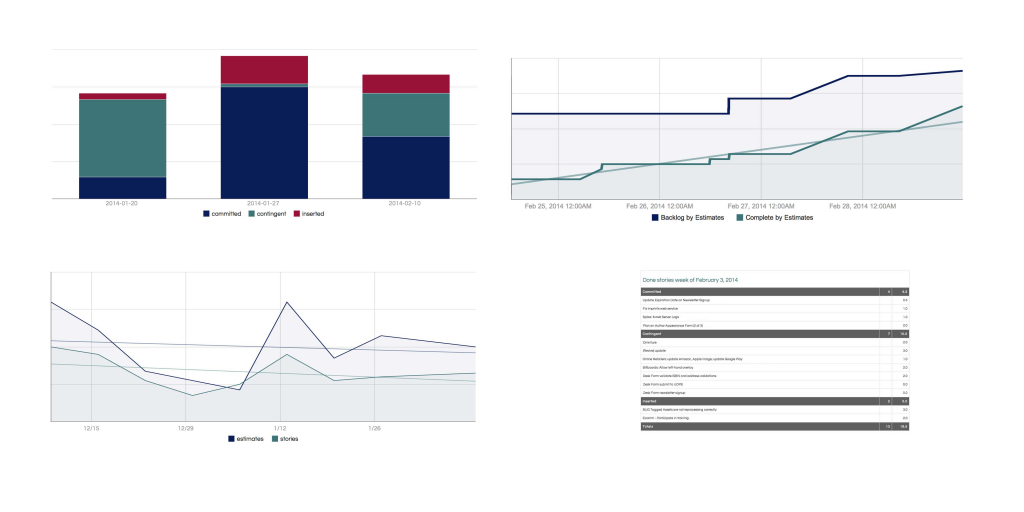
Here’s what the result looks like:

This chart along with selected summary counts and tables allows us a real time dashboard of the health of our sprints.
As you can tell from the burn up, we have work to do improving flow in our iterations.
Anyway, reporting is a work in progress. As is everything.

 I’m working on a pet project I’m calling, for now, ProgressVisualizer. It is intended to be a quick and easy way to create visual reporting for Trello boards.